What Measurement Engineers do

We often get the question “what is it actually you do”? So join us for a typical task that we are now allowed to talk about. It all started with request from a vehicle manufacturer that designed a new rear suspension (double wishbone, independent, driven) and asked us how to test it.
Easy, right? Well, lets take a look at the construction first. Here is a schematic view from behind the vehicle.

It comprises two A-shaped arms that are mounted to a subframe. Since the axle is driven it also needs drive shafts (or half shafts) (green) which are connected to a differential (blue). The fun starts as soon one applies load to that axle or drives on uneven roads. Lets take a look what happens:

The drive shaft (green) needs to change its length to allow for the suspension travel. There are many ways to tackle this, our customer chose to let the shaft slide in and out the rear differential while the wheel-side was bolted in place. Here is an example how this usually looks:
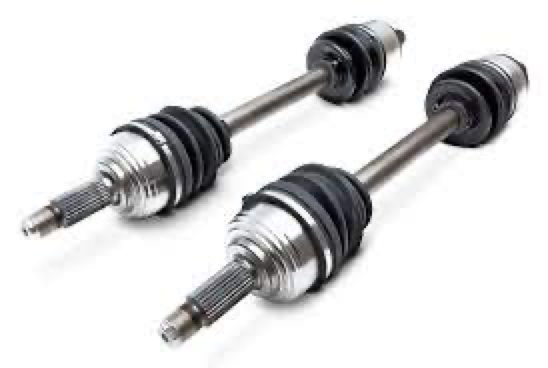
You can see riffles on the shaft (lower right corner), these slide in and out the rear differential to allow for a certain length adjustment during suspension travel. So, why do we need to measure something here? Well, the particular vehicle was able to apply a very big amount of torque (5000 Nm) to its wheels. Also while carrying a tremendous load per wheel (4000 kg). If this torque is applied during suspension travel (You are accelerating while driving trough a pothole) there might occur a problem:
What do you think?
Due to the very high torque the friction gets so high (between the drive shaft and the differential) that it may need more force to slide in or even get stuck. In this case the driveshaft would apply a quiet significant axial force towards the differential.

This particular differential was made out of very lightweight aluminium alloy and was not designed to take a lot of axial force. It was something in the magnitude way below 100 N.
What to test?
So we discussed together with the simulation team what the most critical configurations may be. Result: Driving with maximum load and maximum torque applied over unsteady surface that forces one side of the axle to almost use its full suspension travel. You may have guessed this already, but think about it, how do you wanna test this? Repeatable, safe and maybe also in decent time? There are thankfully some nice test tracks in our area that have special roads which force vehicles into 20cm suspension travel or even more. That box was checked.

Example picture from Volvo Newsroom, not the vehicle we tested.
The test drivers where more critical since it is not an easy task to get the timing right. We want to apply maximum torque in a particular waypoint: When the wheel has traveled down and is close to be forced up again. You may imagine a vehicle able to apply that level of torque and carry such weights is nothing like a F1 car that is quick on throttle response… But, our driver team spend some time training this task and found some “hacks” to force the vehicle into what they called “manual road rage mode”. Check!
Just a few of measurements, right?
Now we needed to fix a measurement system for the whole test. The onboard CAN-bus system provided us with same basic essentials like engine mode, RPM, Speed, Gear – I know – we do not trust on board production sensors, but engine RPM unfiltered from the ECU and actual gear info is quite safe to use. But the rest would need some external sensors. Suspension travel was solved by an active wire potentiometer, axle load by an external scale, prior to testing. Axle torque and axial force? Axle torque was possible with strain gauges, glued to one half shaft and equipped with a radio transmitter (because the axle rotates). Because we where a bit curios we fitted those strain gauges to both half shafts AND the kardan axle. {We wanted to allow for some sanity checks (Total torque = Kardan Torque = Half shaft Torque 1 + Half shaft Torque 2 + Friction losses) and make some side tests which influence gear oil temperature has on the friction losses. }
But axial force? How to measure the force towards the differential? It’s a quite impossible task to do this with strain gauges on the half shaft. So we needed to find another method to measure the axial force.
Actio = Reactio
So our idea was to check everything that reacts as soon as the half shaft would apply axial force. The gearbox / differential mounting was a good candidate. Sadly the incoming kardan shaft and the other wheel ruined this idea very fast. Glueing strain gauges on the differential housing? Quite the same issue, there are many ways the axial force could be absorbed and we could not find any reliable point to measure. Even with the help of a few more simulations and meetings. So we finally took a long look at the bearing. This is the only component able to receive axial force and to transmit them into the housing. It can also be easily replaced (well.. in comparison to a complete differential). And that is something we love, because we can prep it without the vehicle and we can make more than one, in case something breaks.
So how to measure axial forces on a ball bearing? I think SKF will have some answers to this, but we haven´t had access to SKF at the time being. We asked a workshop to mill four grooves into a set of bearings, and glued strain gauges (full bridge) to it.


Now we needed to test and also calibrate our new born “axial force transducer”. We simply took a calibrated force transducer, our bearing and a huge hydraulic press for this. Calibration is a whole article of its own but in short, we looked for two crucial things:
- Scaling. Meaning we applied 100N and noted the output of our transducer, applied 200N and noted, applied…. the whole way
- Linearity. Is it linear in its response? Will it return to zero when no force is applied? Is it repeatable?
As always we discovered something we did not expect, a weird offset between our four strain gauges. Thinking and thinking and testing again it suddenly became clear: A ball bearing is made out of balls. And yes- we where able to measure if a ball was directly on our gauges or not… obvious lesson learned.
Start your engines
From here it was quite straight forward, we prepared a calibration document for the bearing and saved the scaling in our measurement system. We booked track, drivers and vehicles together with the test engineer and also booked a transport truck to get the vehicle directly from the workshop to the track (You do not want to drive long ways over public roads with all these sensors attached and especially not with a prototype rear axle). And then the real fun part started! It was very crowded inside the vehicle since we needed one to manage the data recording system, one driver, the developer of the axle and also the test engineer where not willing to wait outside either. We bumped over the track, maximum load, maximum acceleration and maximum suspension travel. Thankfully someone invented proper seat belts and thankfully we tied all of the equipment carefully down.. what a ride! After every approach we took a look at the measurement data and named the logging file accordingly.
Everyone is happy
After a few attempts it become quite fast clear: No risk for the differential, the construction is sound and well done. Our measurement system and transducers worked fine and we exported proudly the raw and interpreted data down to a thumb drive. After that there was only un-prepping left. But since that particular case I have been well fascinated with observing wheels and suspensions during highway travels 🙂
Picture credit for top image:
https://www.fijen.se/wordpress/2021/02/21/volvo-hallered-proving-ground-in-sandhult/
Picture credit for driveshaft picture:
https://www.driveshaftuk.com/the-common-signs-of-driveshaft-problems/